SoilBuddySoil Intelligence

Science & methods

The science behind SoilBuddy

A clear look at the data, methods and limits behind every recommendation. Every number in the app comes from a published rule or a named dataset — no language model computes any number.

A source for every number

Satellite and weather coverage includes all three demo regions; extra local datasets vary by country.

  • NASA SMAPSoil moisture · 9 km
  • NASA HLSCrop greenness · 30 m
  • NASA POWERDaily weather · ~0.5°

Data

Data sources

Provider · What it gives · Resolution · Access

  • NASA NSIDC DAAC

    Root-zone and surface soil moisture, drought percentile, probe comparison

    Resolution
    9 km · 3 h
    Access
    Earthdata cloud OPeNDAP (token)
  • NASA LP DAAC

    Crop greenness (NDVI) vs. the field's own 2001–now normal; regional season tracker

    Resolution
    250 m · 8–16 d
    Access
    Cloud-optimized files via Microsoft Planetary Computer; ORNL DAAC fallback
  • NASA LP DAAC

    Field-scale greenness, cloud-screened (Fmask)

    Resolution
    30 m · 2–3 d
    Access
    Cloud-optimized files via Planetary Computer
  • NASA LaRC

    45 years of daily weather → crop water use (FAO-56 ET₀), water balance, climate-shift trends, 30-year planting replay

    Resolution
    ~0.5°
    Access
    Open REST, no key
  • NASA EOSDIS

    Live NASA map layers by date

    Resolution
    —
    Access
    Open WMTS, no key
  • NASA GSFC

    Fires, storms, floods and drought within 250 km of the field (last 30 days)

    Resolution
    event points
    Access
    Open REST, no key
  • NASA LANCE / FIRMS

    Fires seen by satellite within 50 km of the field in the last 5 days (crop-residue burning, wildfires)

    Resolution
    375 m · ~3 h
    Access
    Free MAP_KEY
  • USDA NRCS

    US soil texture, organic matter, water-holding capacity

    Resolution
    survey polygons
    Access
    Open REST/SQL
  • USDA NRCS

    Real in-ground soil moisture at the nearest station (US, within 200 km) as a regional check of SMAP and the water balance. SoilWeb (UC Davis) and the USDA series descriptions are linked from the Soil tab

    Resolution
    station · daily
    Access
    Open REST, no key
  • USDA NASS

    County yields (5-year mean) and US crop history

    Resolution
    county / 30 m
    Access
    API key / open
  • ISRIC

    Soil properties outside the US (checked against FAO-56 Table 19)

    Resolution
    250 m
    Access
    Open REST (beta)
  • ECMWF via Open-Meteo

    16-day forecast and 6-month seasonal outlook

    Resolution
    ~36 km
    Access
    Open, non-commercial
  • Ambee (EONET + GDACS)

    Alert levels for nearby events; 4-week fire-risk forecast (North America). Trial key: when it ends the app uses NASA EONET only

    Resolution
    events · weekly
    Access
    API key (15-day trial)
  • EOX / Copernicus

    Map background imagery

    Resolution
    10 m
    Access
    WMTS (CC BY-NC-SA 4.0)
  • Taylor Geospatial Institute & Microsoft AI for Good

    Suggested field outlines for “Find my field” — AI predictions, not surveyed boundaries; the farmer checks and corrects every corner

    Resolution
    AI model on Sentinel-2
    Access
    Open PMTiles, read by your browser (CC-BY 4.0)

Nutrients

How we estimate nutrients

From the probe's readings to soil-test values and nitrogen rates — always with the confidence shown.

Phosphorus and potassium, honestly

Probe P and K measure what is dissolved today, not the soil's reserve. Until a lab test (Olsen/Bray, ammonium acetate) calibrates the probe at a site, they are shown as early hints with LOW confidence, using crop-specific bands (maize and small grains need less solution P than vegetables — Fox 1981).

How much nitrogen

Minnesota corn: University of Minnesota MRTN rates by previous crop; in season, the ISU late-spring nitrate test (25 − ppm) × 8 lb N/acre, capped by what was already applied. Elsewhere: crop need × realistic yield − soil nitrate − organic-matter release − legume credit, ÷ 60% efficiency. Rainfed wheat/barley yield = 20 kg/ha per mm of season rain above 110 mm (French & Schultz 1984), adjusted by the SEAS5 rain outlook.

Fertilizer on chalky (calcareous) soils

MAP rather than DAP, banded near the seed (FAO). Nitrogen as urea drilled or mixed into the soil, or spread just before ≥12 mm of rain or irrigation. Ammonium sulfate is not safer on these soils: left on the surface it can lose up to ~50% of its N as ammonia (Fenn & Kissel 1975).

Measurements from people

Signed-in farmers, students and researchers can add lab soil tests, test-kit readings, texture, pH, moisture or yields to any field they can see. Each entry needs a unit, method, date and an error margin, keeps its author's name, and is never merged with others. Credibility = method weight (lab 0.85–0.9, kits ~0.55, feel ~0.4–0.6) × error-margin factor (not stating one counts like the widest, so honesty never costs) × a small bonus for 3+ samples. The best measurement per soil property corrects the soil map (water holding recomputed with Saxton & Rawls); lab P/K within 3 years and lab nitrate within 14 days replace the probe's uncalibrated bands. Private measurements only shape the owner's own advice.

Models

Our models

Water balance, a 30-season crop replay, climate trends and the season tracker — all from published rules.

Your field's outline and the data grids

A drawn outline is checked (no crossing edges, 100 m² to 10,000 ha) and measured on the true shape of the Earth (WGS84 ellipsoid). Each dataset keeps its own cell size: weather comes in ≈50 km NASA POWER cells — when your field crosses a cell edge, the cells are blended by how much of the field lies in each; US soils use every SSURGO soil map unit inside the outline, weighted by area (names and drainage from the largest soil; calcareous if a fifth of the field is); 30 m HLS greenness is the average of the clear pixels whose centre is inside the field. SMAP (9 km) and the 25-year MODIS record (250 m) stay what they are — a drawn outline shows which cells are yours but never makes them finer. Pin-only fields are analysed exactly as before.

What to plant, and when

Every crop is simulated through the last 30 seasons of this field's own NASA weather and soil. The planting window comes from the field's own dates: the median last spring frost and when the soil warms to 10 °C (corn) or 7 °C (hardy crops); for rainfed winter crops, the first rain of ≥20 mm in 3 days with no 10-day dry spell after it. Each crop gets a yield, water and risk score; recent 15 years are compared with earlier ones, and US yields use the county's own USDA NASS 5-year average.

Probe reading → soil test (nitrate)

Soil-test equivalent (mg/kg) = C (mg/L) × θ / ρb; nitrogen in the layer (kg/ha) = C × θ × depth (m) × 10. Nitrate moves with water, so this conversion is physical, and a drying soil can't fake a high reading. Enough = 25 mg/kg for corn (PSNT/LSNT), 20 mg/kg for vegetables and small grains (UC quick test).

Water balance

FAO-56 Penman-Monteith ET₀ from NASA POWER; crop coefficient by growth stage; root-zone depletion with water-stress coefficient; NRCS curve-number runoff; drainage = leaching. Mapped soil water outside FAO-56 Table 19 for its texture is replaced with Saxton & Rawls (2006). Season relative yield = 1 − Ky (1 − ETa/ETc) (FAO-33).

Climate shift

Per-season farm-climate indicators (frost dates, frost-free days, heat units, hot days, first autumn rain, dry spells, heavy-rain days, soil wetness, rain minus crop water use). Mann-Kendall trend test with Sen's slope; early period vs. the last 15 years.

Probe vs. satellite

Probe moisture is compared with SMAP L4, MERRA-2 and our water balance: correlation, bias and ubRMSE (SMAP's target is 0.04 m³/m³). Mean–standard-deviation matching rescales the satellite series to the field (Reichle & Koster 2004), giving calibrated daily moisture for neighbours without a probe.

Regional season tracker

This season is compared, day by day, with every season since 2001 at verified cropland points: rain, soil wetness, heat units, hot days and MODIS greenness. The closest past years are shown with their known harvests. An indicator, not a yield forecast.

Honesty

What is real, what is simulated, what is assumed

Real (measured or published)

NASA weather since 1981, MODIS/HLS greenness, SMAP moisture, soil maps (SSURGO, SoilGrids), US crop history and yields (USDA), forecasts (Open-Meteo), nearby natural hazards and satellite fires (NASA EONET, FIRMS), agronomic rules from cited publications, and measurements people add under their names.

Simulated (and labelled)

SoilBuddy probe readings on the demo fields — the device is still in development. They come from a physical model driven by real NASA weather, and say “simulated” everywhere they appear.

Illustrative or assumed (and labelled)

Prices and costs, the “regional typical yield” where no statistics exist, the regional soil estimate where no map exists, crop types in the Syria/Saudi demo histories, and a few conservative defaults in the spray window.

Low confidence until lab-checked

Probe phosphorus and potassium measure what is dissolved today; they need a site calibration against lab tests and are marked LOW confidence until then.

Full list: docs/DATA_HONESTY.md in the repository.

Limitations (honestly)

  • Probe values in this demo are simulated by a physically consistent model driven by NASA data; the hardware is in development.
  • P and K need a site calibration against lab tests.
  • SMAP sees a 9 km cell; the L4 land model may classify a cell as peat or wetland. We choose a representative cell and say so.
  • Global soil maps (250 m) are approximate; a lab soil test makes everything sharper.
  • Prices and costs are illustrative; scores are for relative comparison.
  • Seasonal forecasts have modest skill outside the tropics.
  • The season tracker is an indicator, not a yield forecast.

AI-use disclosure

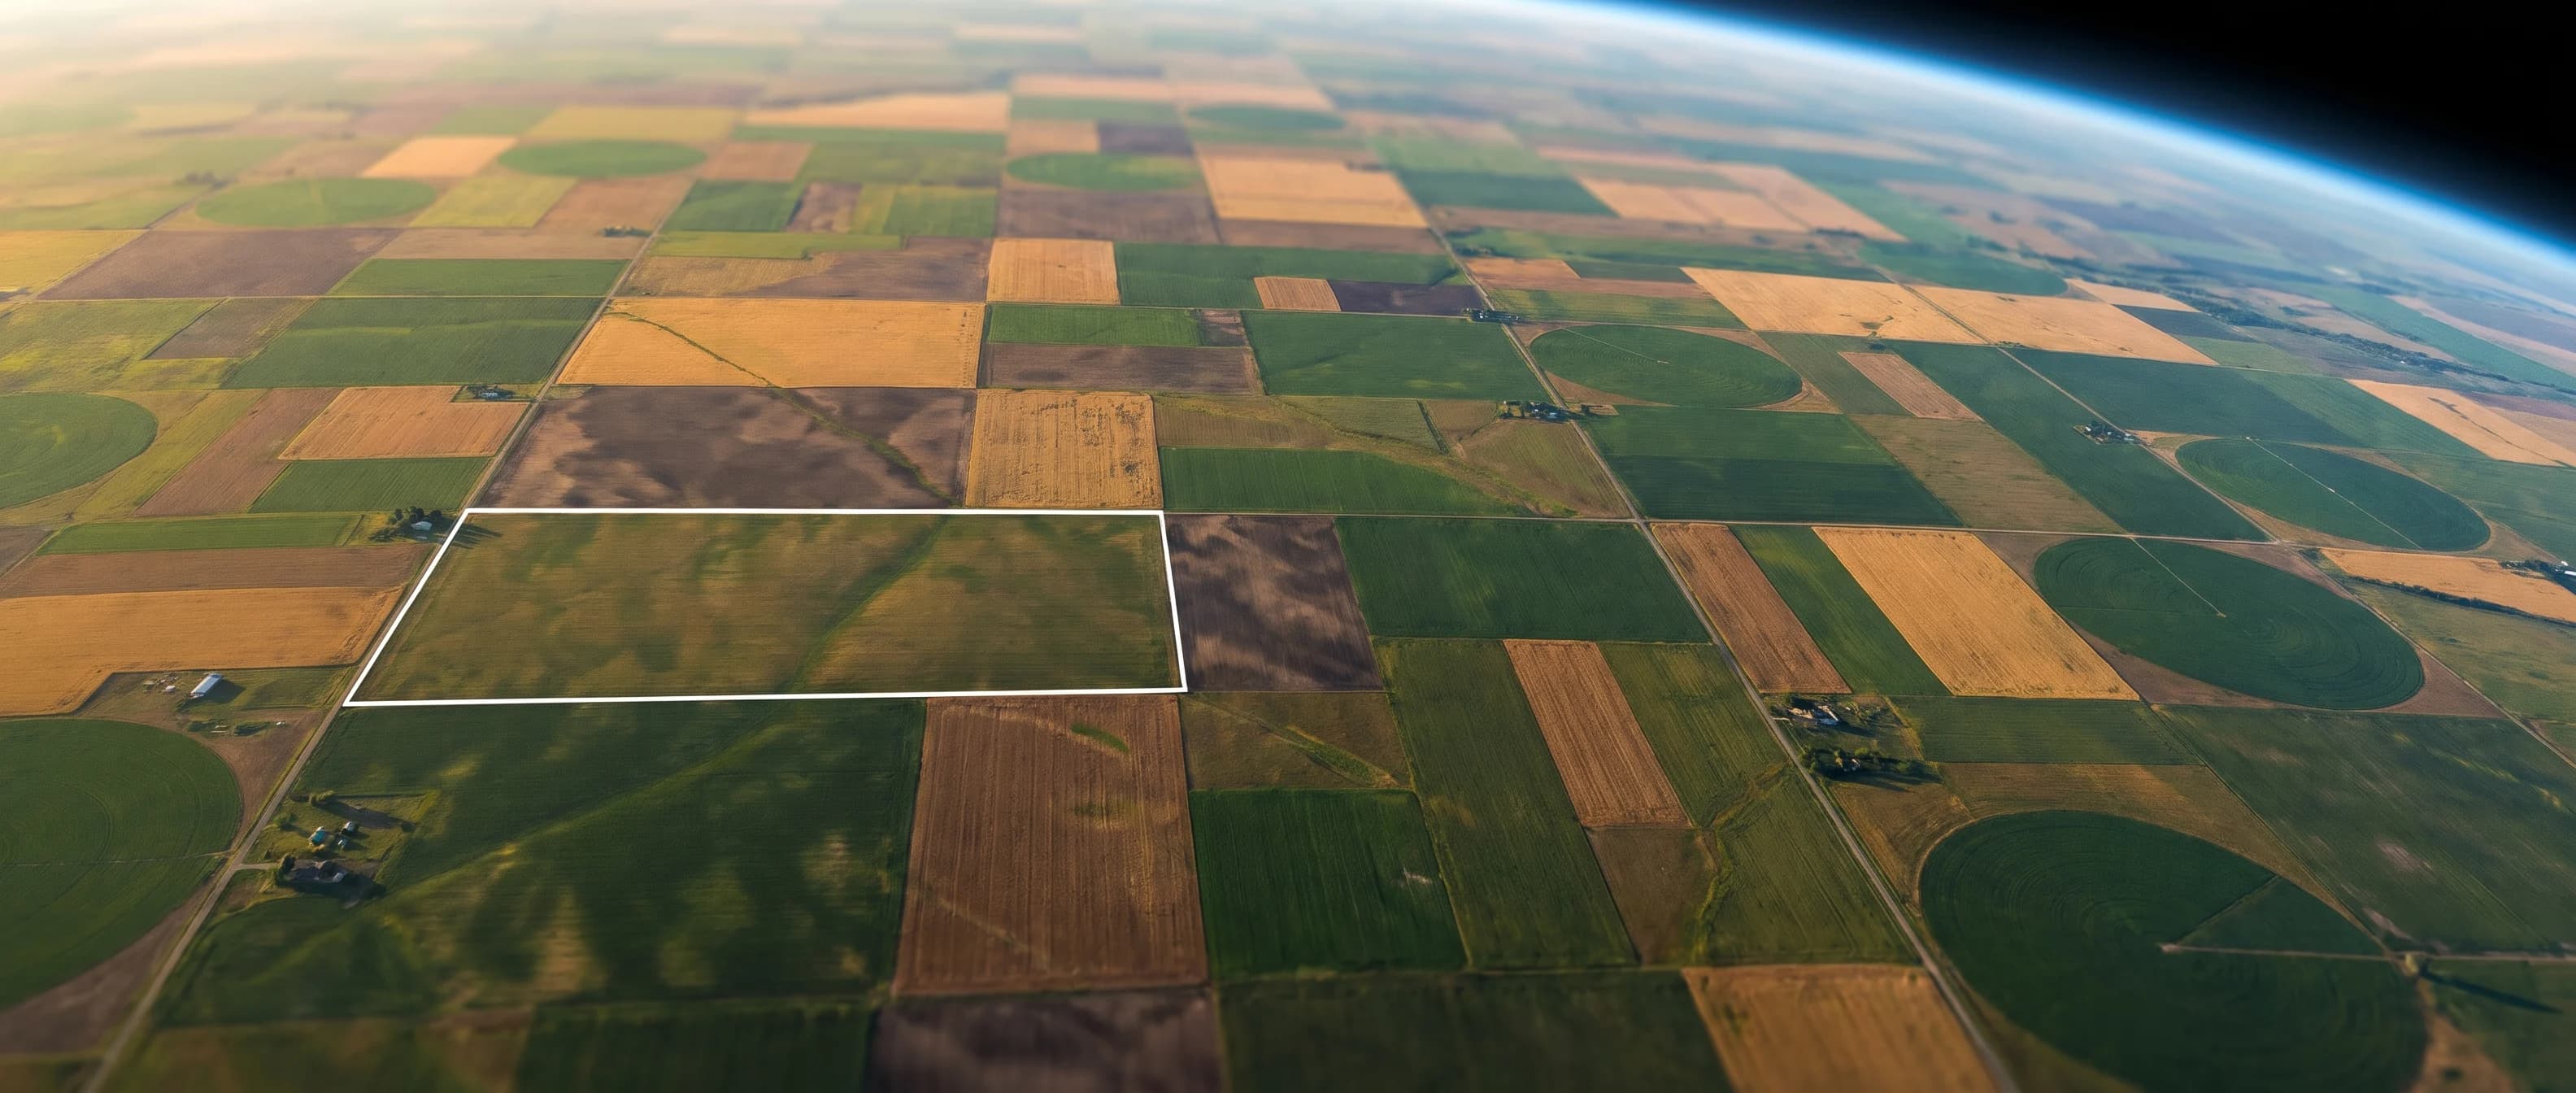
Ask SoilBuddy explains numbers already calculated from the available data; we do not use it to invent readings or calculate recommendations. Photo checks suggest possible causes of visible crop symptoms and can be wrong; they are not a confirmed diagnosis. We keep only the written result, never your photo. Marketing and page-header pictures are AI-generated illustrations. Field data identifies its sources, with simulated readings and estimates clearly labelled.

Sources

References

Full citations and source links.

Loading your field…

    Try it on your land

    All of this data can work for your own field

    Mark your field on the map and within about a minute we gather 45 years of NASA weather and satellite images for it — free.